Financial report: main page
The main page of the financial report is located in "Analytics" → "Financial report" and is used for financial analysis across all projects.
It allows you to:
evaluate income and expenses
track payment deviations
analyze profit
review detailed data by project
Filters
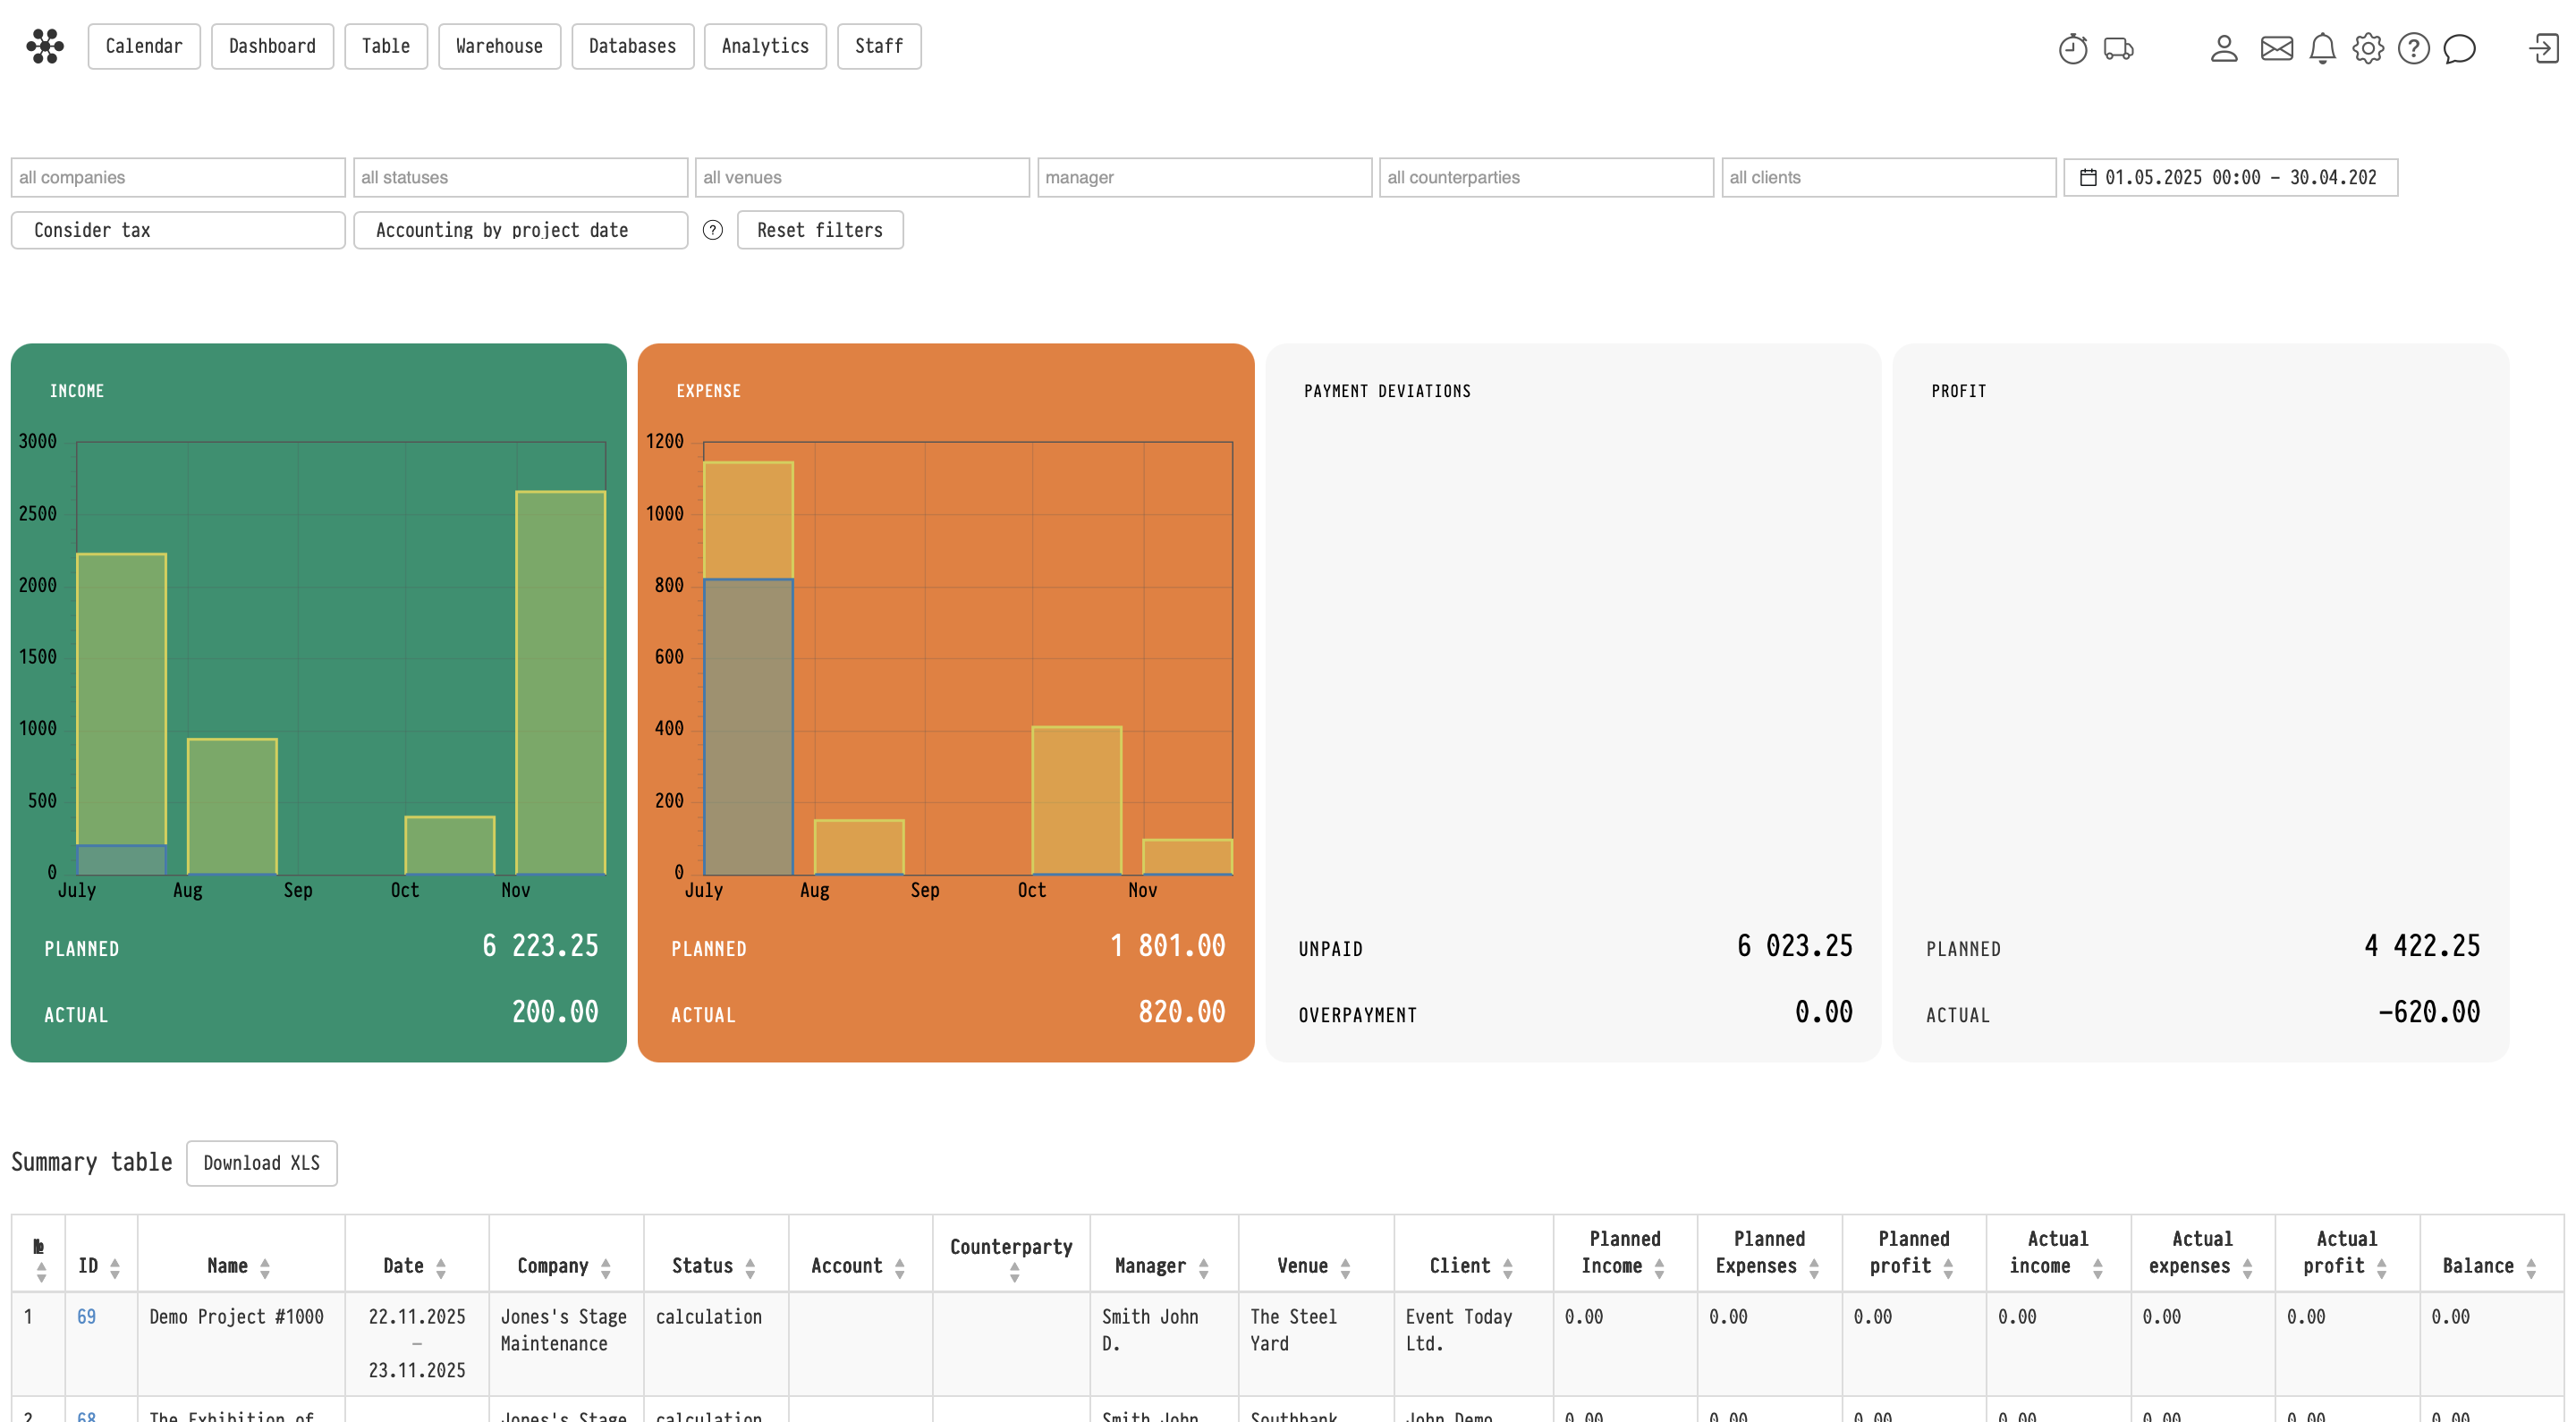
At the top of the page, there is a filter panel. Selected filters are preserved when navigating within the report.
The same filter panel is on every page of the financial report: in "Income", "Expense" and their subsections, and in "Payment deviations". When you go from page to page, the selected companies, statuses, period and other settings move with you. The main page also remembers the filters the next time you open the report. The "Reset filters" button returns everything to the default values.
Available filters:
My companies. Used to filter data by your legal entities. Important: there is no single "project company" in the system: the company is assigned at the estimate sheet level. This means:
one project can include sheets with different companies;
planned income is taken only from the estimate sheets of the selected company;
actual income includes only receipts with the selected "Recipient company";
expenses include only those with the selected "Paying company". The paying company is selected in the expense window on the project "Finance" tab: in the "Income/Expense", "Staff/Vehicles", "Sublease" and "Project Managers/Fines" blocks.
Estimate status. Filter by project estimate statuses.
Venues. Filter by project venues.
Manager. Filter by the first project role (by default "Manager"). The name of this role may differ if it has been renamed in the settings.
Counterparties. Counterparties are assigned when a document package is generated in the project. Key behavior:
if no document package has been created, the project will not appear in this filter;
a project can have several counterparties; they are displayed as a comma-separated list;
the project is included if it matches at least one selected counterparty.
Clients. Filter by project clients.
Document Status and Financial Status. Filter by the manual project statuses, including "not specified" for projects created before the statuses appeared. In the project table these statuses are shown in the "Documents" and "Finance" columns. See Document and finance statuses.
Period. Time range for analysis.
Consider tax / Do not include tax:
"Consider tax": values include tax;
"Do not include tax": tax is excluded from income and expenses.
Accounting by project date / Accounting by expense date. Defines how expenses are considered:
by project date: expenses are linked to the project dates;
by expense date: expenses are considered based on their actual payment date.
Reset filters. Resets all filters to the default values.
Please note. If an expense has no paying company selected, it is not included in the report when the "My companies" filter is on. Check the company in the expense window if the amounts for a company look too low.
Charts
In the central part of the page, charts display:
Income (green)
Expense (orange)
Each includes:
Planned: based on the estimate;
Actual: based on real financial data (project "Finance" tab, "Income/Expense" block).
Charts are built by months within the selected period.
Click the "Income" or "Expense" block to open the detailed report: Financial report: Income and Financial report: expenses.
Additional blocks
On the right side:
Payment deviations
Unpaid: how much clients still have to pay under the estimates;
Overpayment: how much clients have paid above the estimate.
Profit
Planned: calculated from the estimate;
Actual: calculated from actual receipts and expenses.
Click the "Payment deviations" block to open it: there are two lists of projects, "Unpaid" and "Overpayment", with the manager of each project and export to Excel. See Financial report: payment deviations.
Summary table
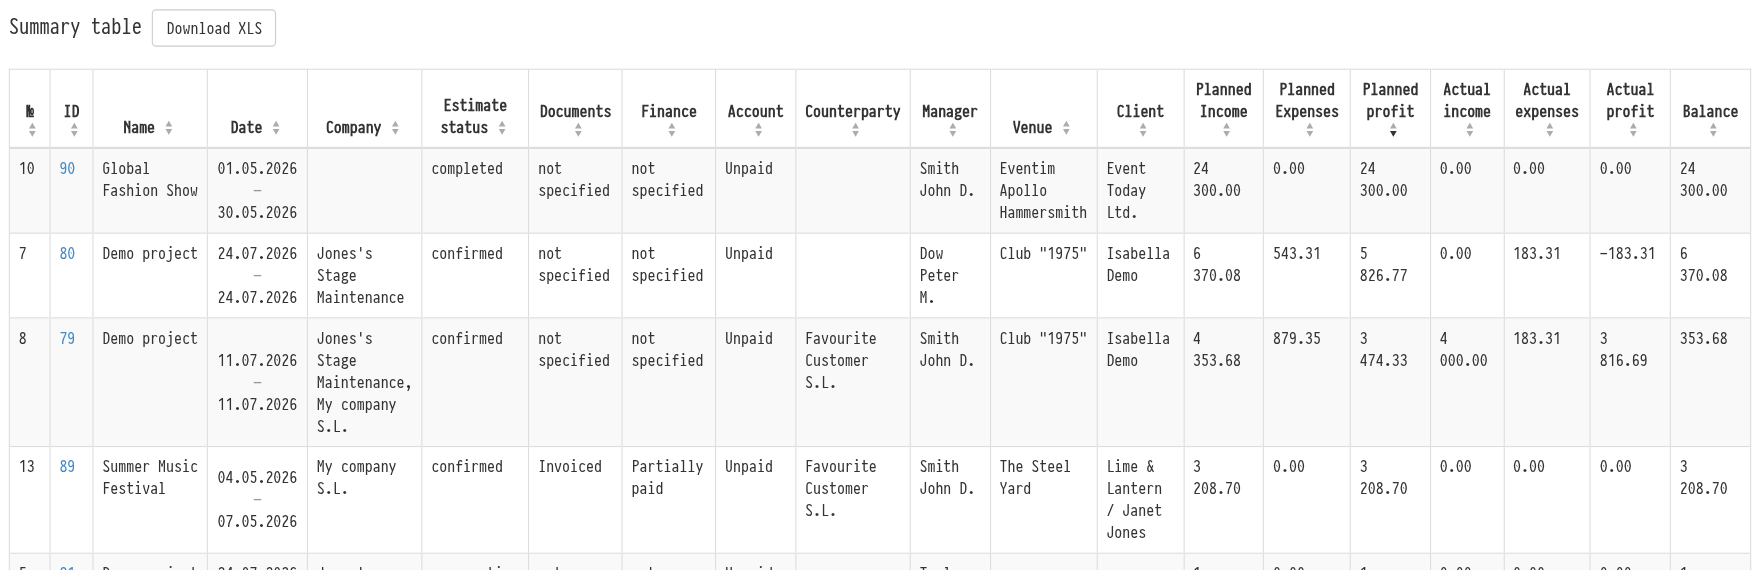
At the bottom of the page there is the "Summary table": the projects matching the selected filters.
The table includes:
project number (ID) and name
date
company
estimate status
document and finance statuses ("Documents", "Finance")
bill
counterparty
project manager: the column has the same name as the first project role (by default "Manager")
venue
client
financial indicators:
planned income, expenses, profit
actual income, expenses, profit
balance
At the bottom of the table there is the "Subtotal" row.
Key behaviors:
clicking the project number opens the project in a new browser tab;
all values respect the applied filters.
You can sort the table by any column: click the column title. Click it again to change the order from ascending to descending. The arrows next to the title show which column the table is sorted by and in what order.
Export
The "Download XLS" button next to the "Summary table" title exports the project table to Excel. Only the table data is exported (charts and summary blocks are not included).
The file contains the projects matching the current filters, in the order in which you have sorted the table.
Key concepts
Finance, Analytics, Income, Expense, Profit, Project, Manager, My companies, Paying company, Counterparty, Client, Estimate, Filters, Summary table, Payment deviations, Report