Display modes
The calendar shows the same data from different angles. The bar above the grid is split into two groups: the period on the left and the view on the right. They combine with each other. The rest of the bar is covered in Calendar interface.
Period
Year — twelve months on one screen, projects in a condensed form. Clicking a month switches the calendar to that month.
Month — the default view.
Week — a grid by hours. Projects longer than a day are moved to the all-day strip at the top.
Day — a single day with start and end times. When several projects fall on one day, you see how they are spread across the hours.
The Today button returns you to the current date; the arrows on either side of the period name page it back and forth.

View
Calendar — the familiar grid of dates.
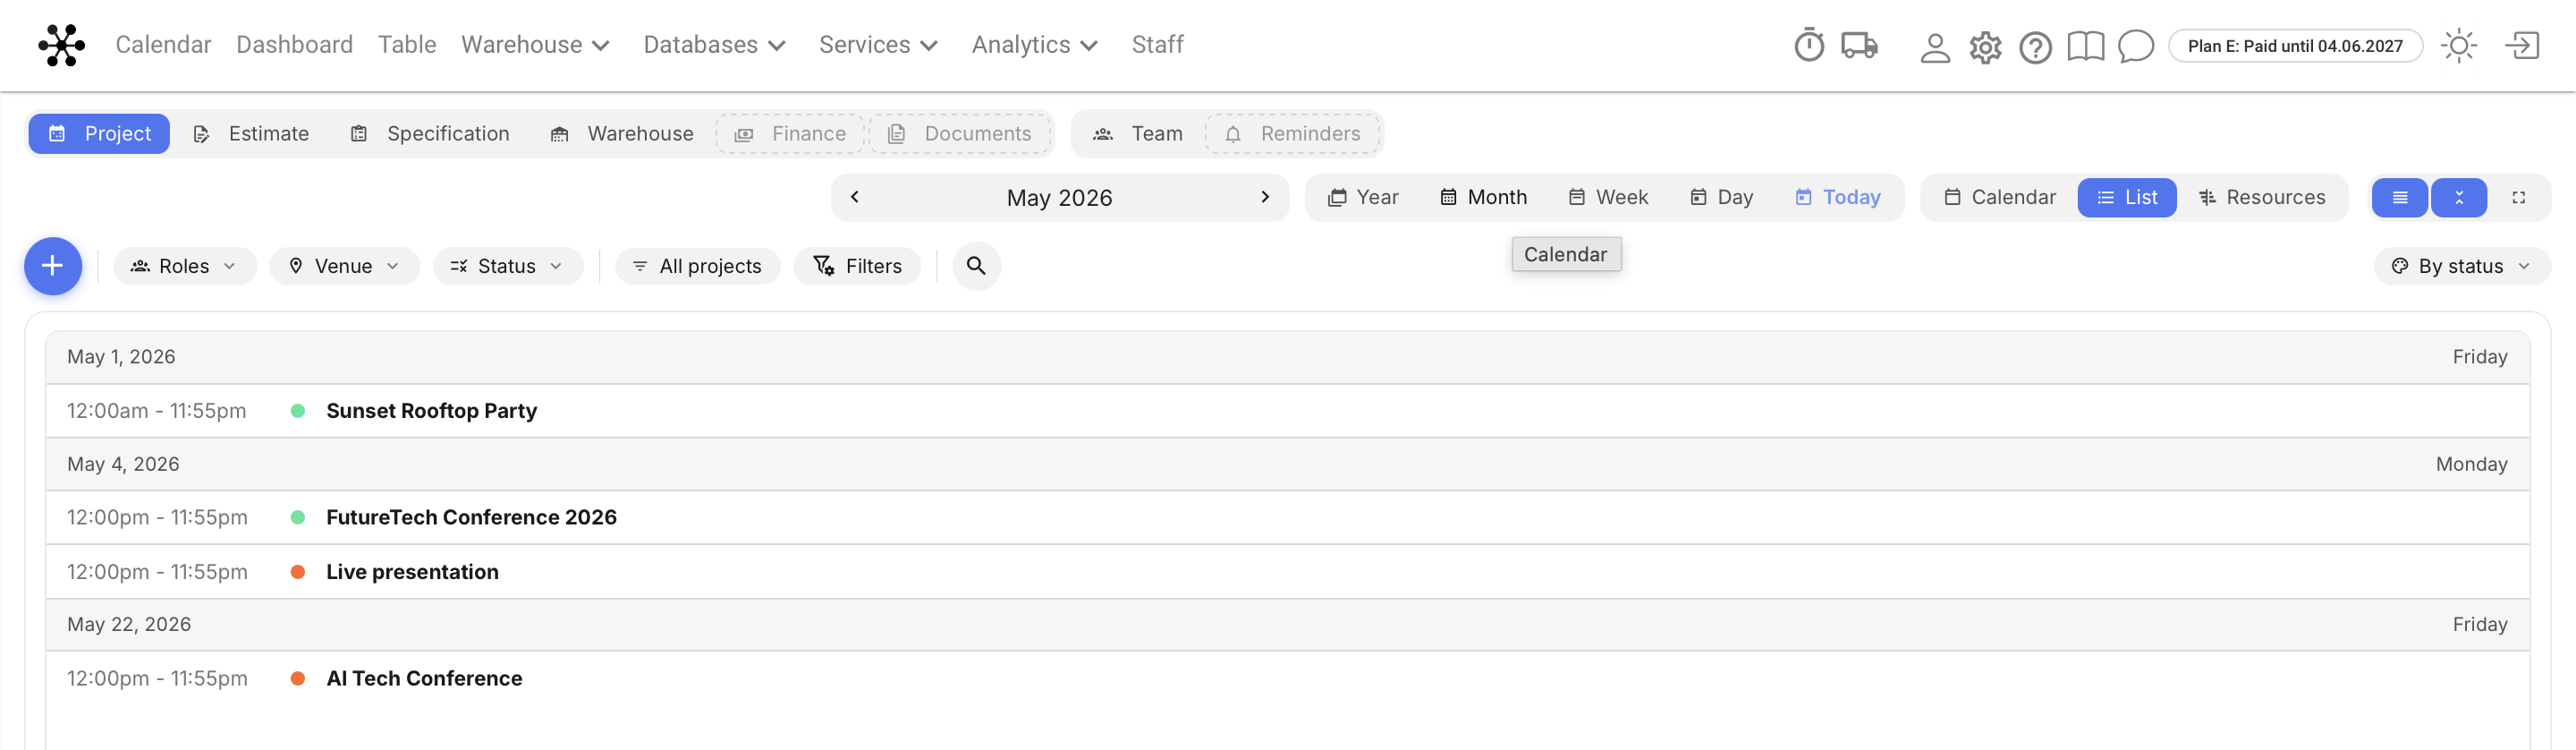
List — events day by day: date, weekday, time and name. A long project is repeated in every day it runs.
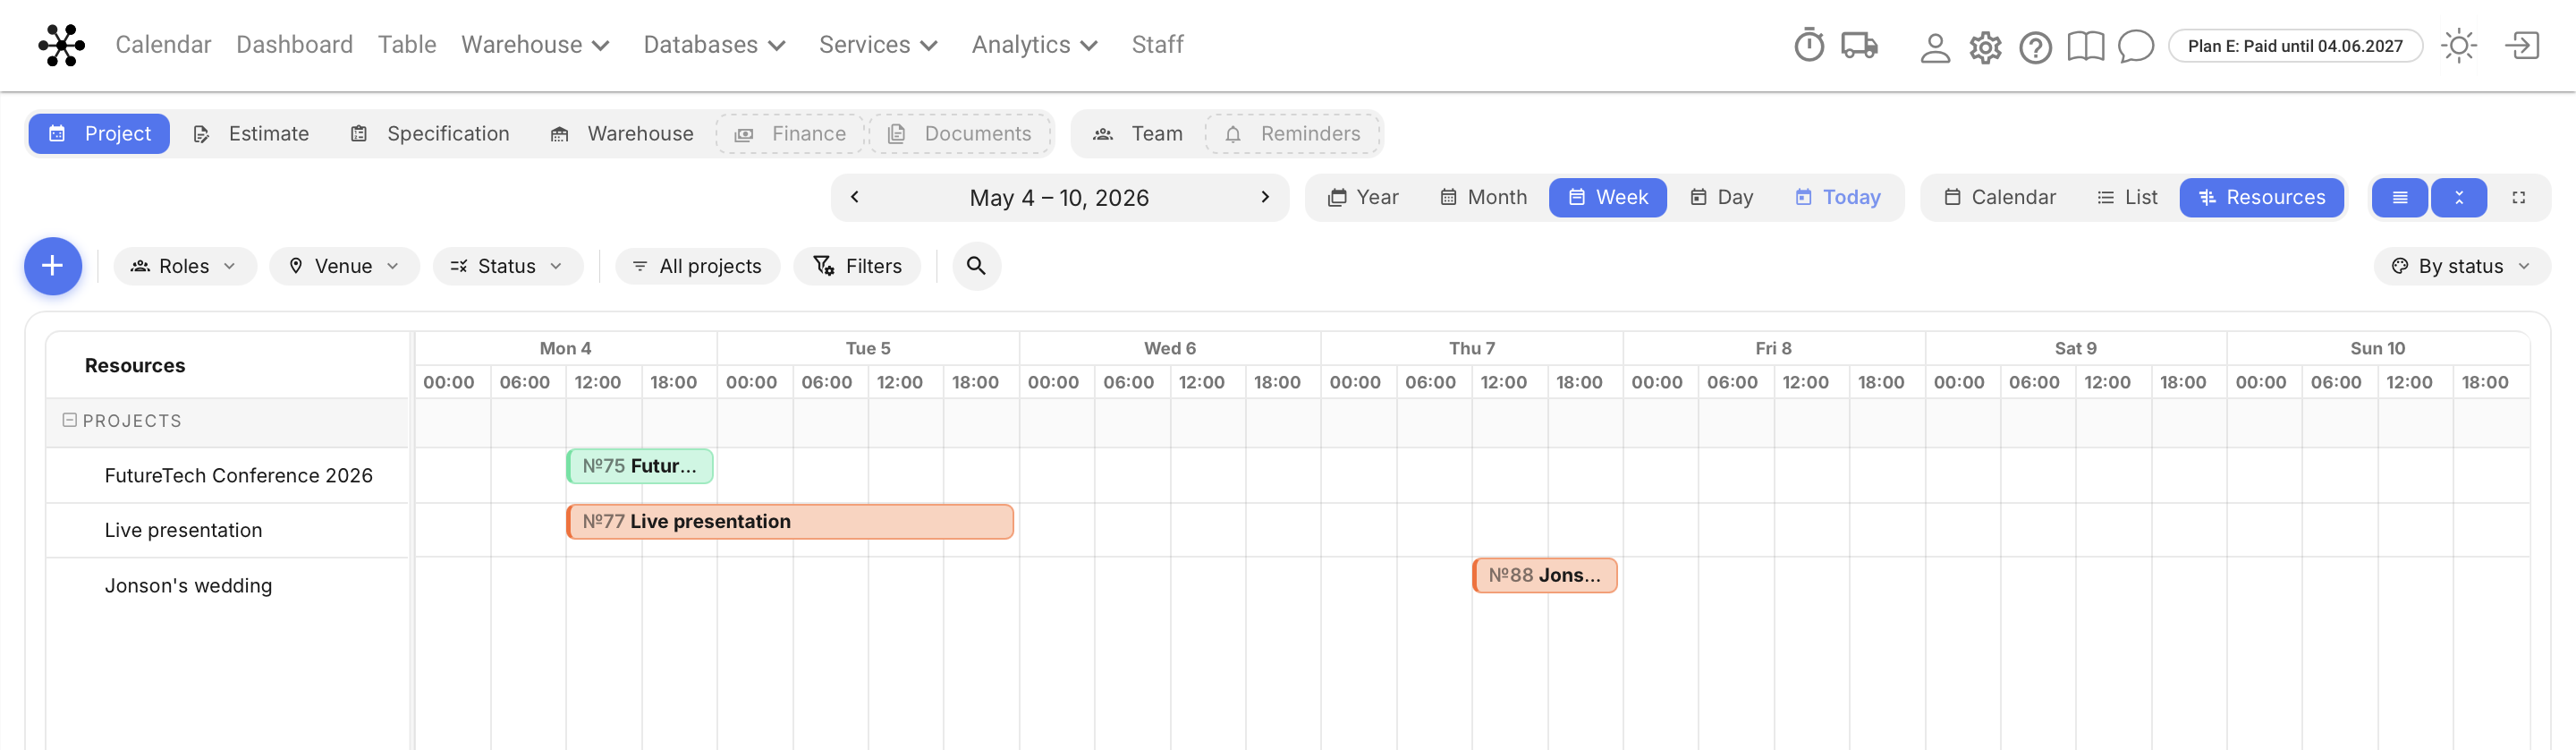
Resources — a Gantt chart: the list of projects on the left, the date scale on top, and bars showing how projects overlap in time. A vertical line marks today. You can open a project straight from here.
Density and full screen
Three icons at the right end of the bar control how much fits on the screen.
Compact event tiles — each project collapses into one line: number, name, status dots and amount.
Collapse cells — no more than three events are shown in a day, the rest hide behind a “+ more” counter.
Full screen — the calendar expands to the whole screen, without the system header.
Full screen mode is handy for a shared screen in the office or the warehouse: pick the Warehouse tab, turn on full screen and put the picture on a TV or a tablet — the team sees the active projects of the day. Which colours the projects take is explained in Appearance settings.